Explore the Globex web application
While the Globex web application used in this workshop is a demo app and as such does not pretend to be a real-life retail application, it packs enough functionality to make it feel like a real retail web app.
In this section of the workshop, you will explore the Globex web application, both from a deployment as well as a functional point of view.
-
From your browser, navigate to {openshift_cluster_console}[OpenShift Cluster Console, window="_console"]. Login with your username and password ({user_name}/{user_password}).
-
You will be redirected to the Developer perspective of the console. A welcome popup might appear, which you can dismiss for now (click Skip Tour). Also, a popup window might appear with details about the perspective switcher. Feel free to close the popup window (or click Next if you want to know more). Finally, you should be redirected to a view which lists the different OpenShift projects (also known as namespaces) you have access to.
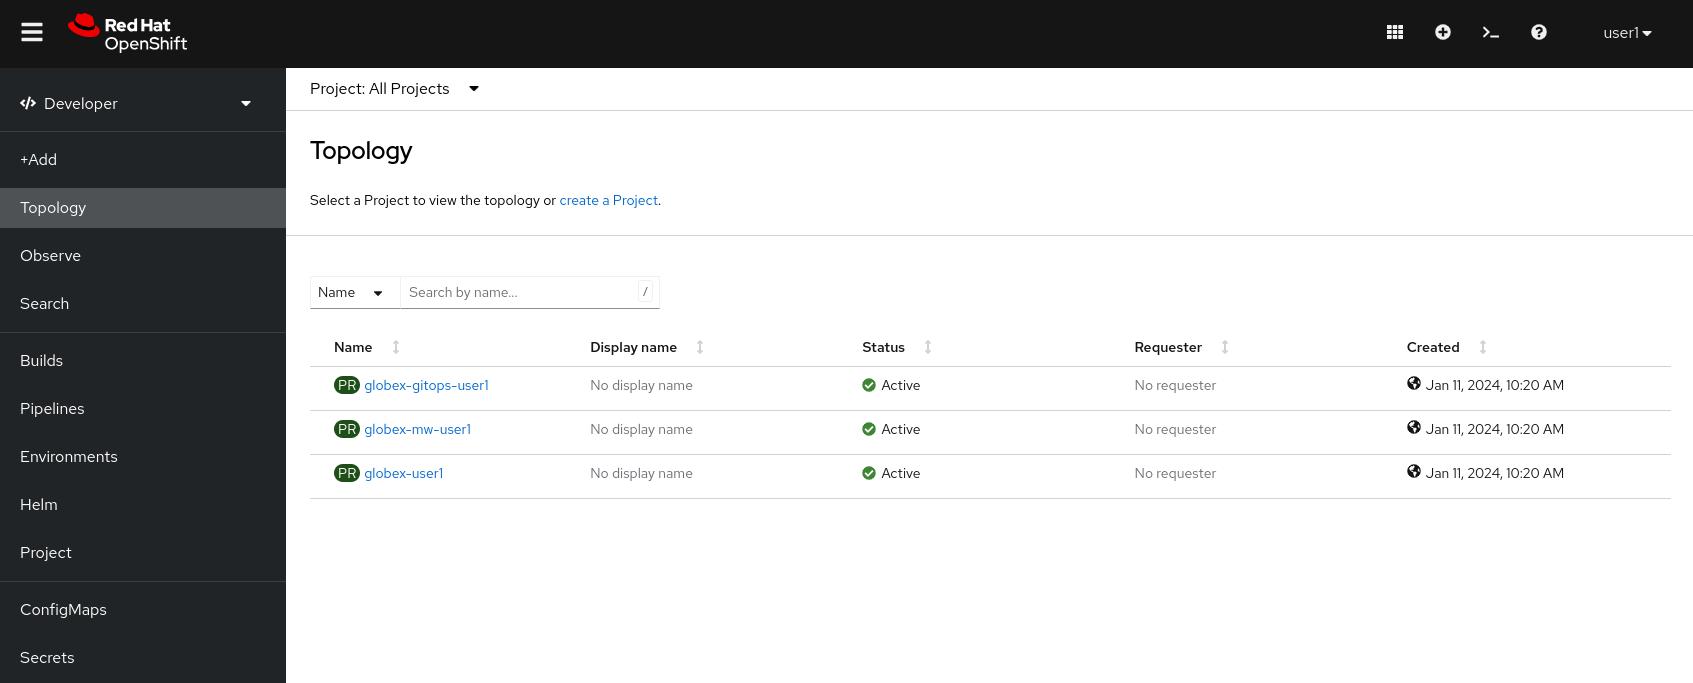
The list of namespaces you have access to will depends on which modules you have deployed.
-
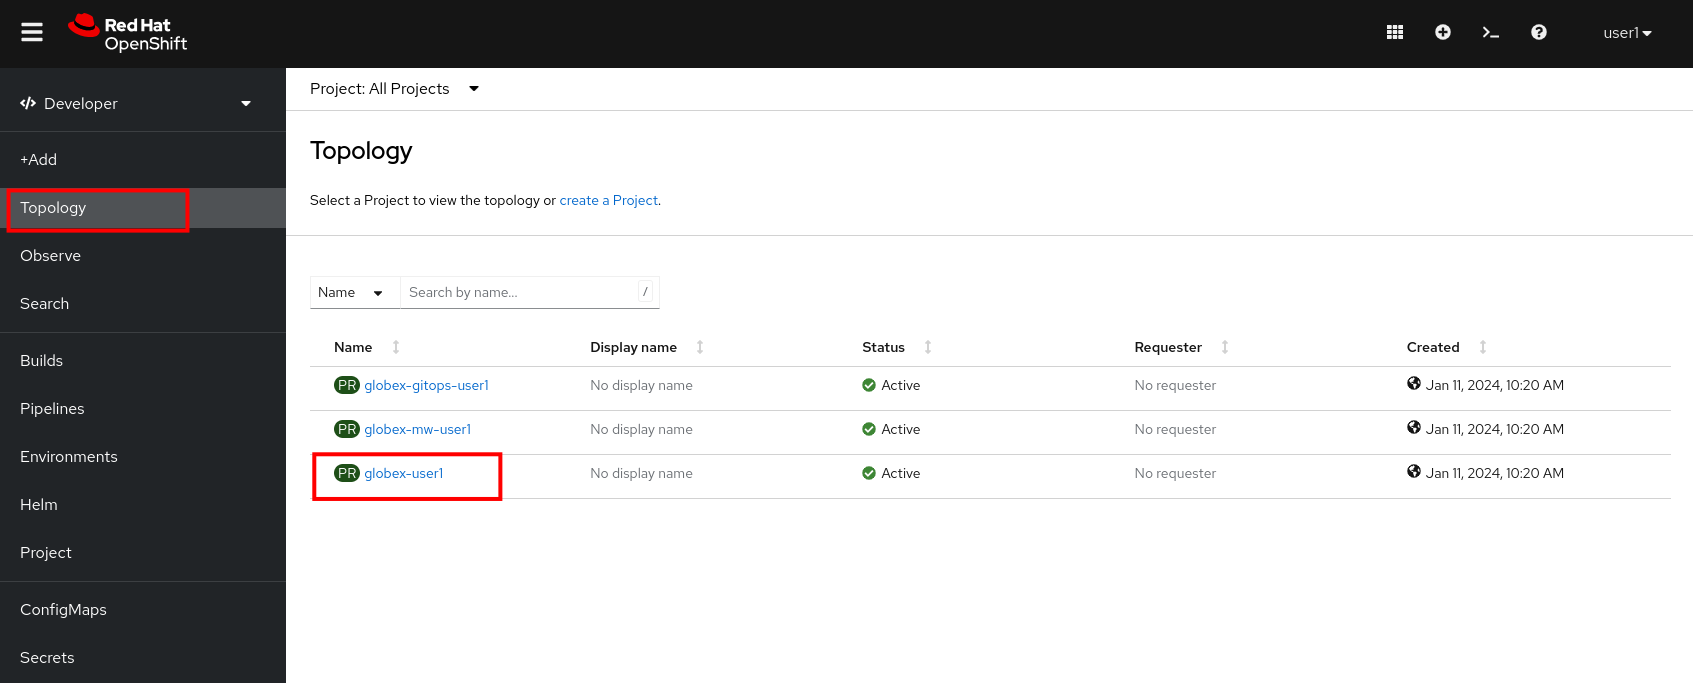
The Globex web application is deployed in the globex-{user_name} namespace. Click on Topology in the menu on the left and then click on the globex-{user_name} link to open the topology view of the namespace. The Topology view gives you a graphical representation of the different resources deployed in the namespace.
-
In the Topology View of the Developer Perspective, expect to see something like this (rearrange the topology as you see fit by dragging the circle symbols that represent the various resources. Please avoid creating connections via the arrows just yet):
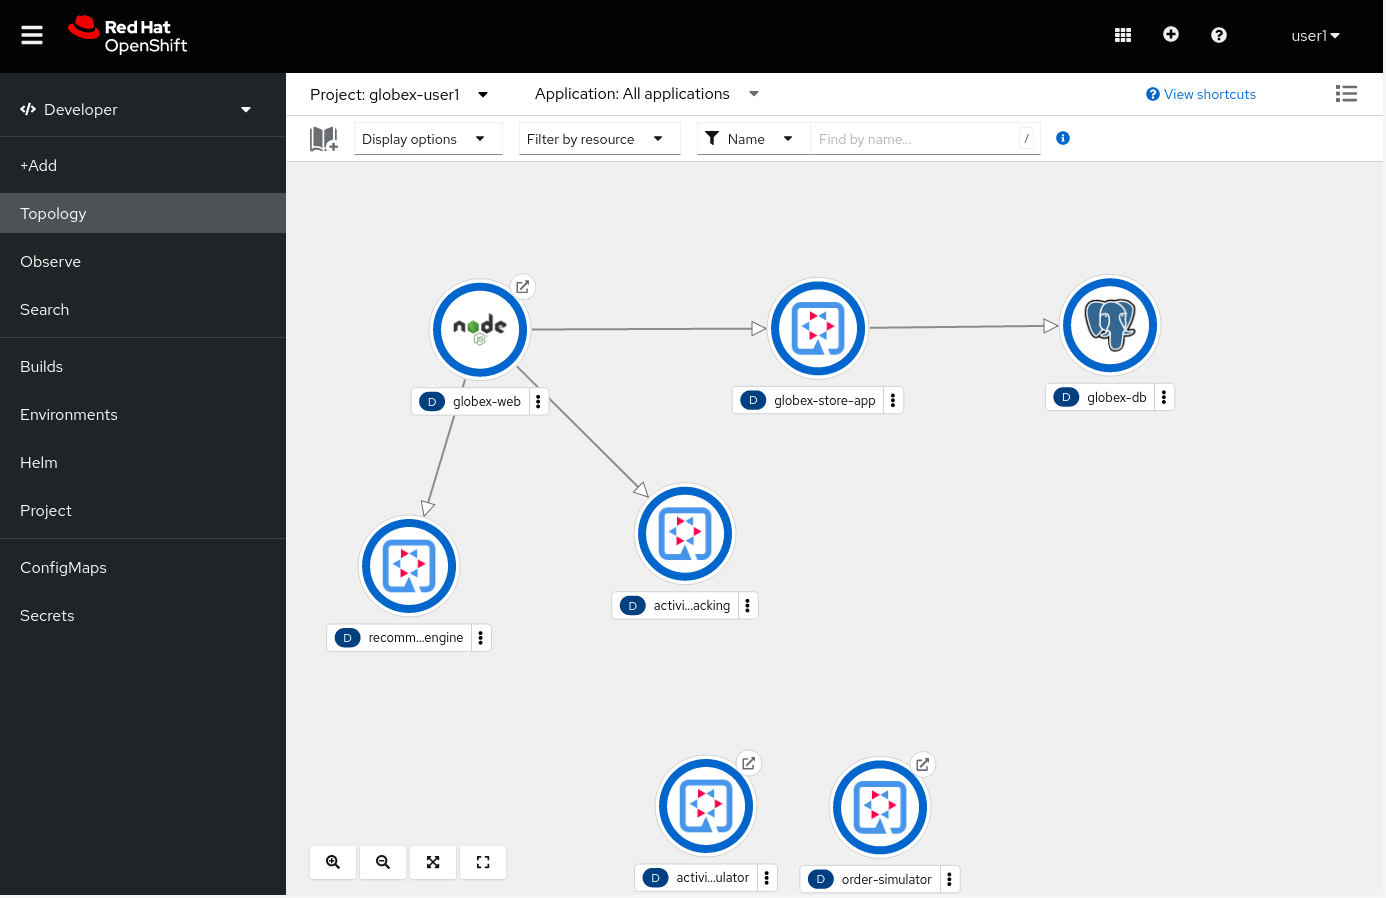
The Globex web-app deployment consists of:
Service Description globex-webThe web front-end of the Globex web application. Running on Node.js with an Angular UI.
globex-store-appThe backend application of the Globex retail app. Written in Quarkus. Provides catalog, inventory, cart and order services.
globex-dbThe PostgreSQL database used by the globex-store-app application. Stores the catalog, inventory, customer and order information.
activity-trackingThis microservice has a REST endpoint for user activity events generated from the UI. These events are produced to a Kafka topic.
recommendation-engineAn example of an application which does real-time processing of an event stream. This application uses Kafka Streams, an event-streaming library, to process the stream of events produced by the activity tracking service to build a list of the most popular products on the web site. This list is exposed as a REST endpoint, and called by the front-end to display featured products.
-
To open the Globex web application, click on the
 symbol next to the globex-web deployment in the topology view.
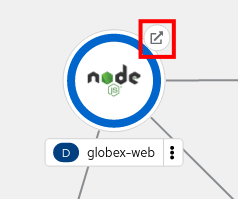
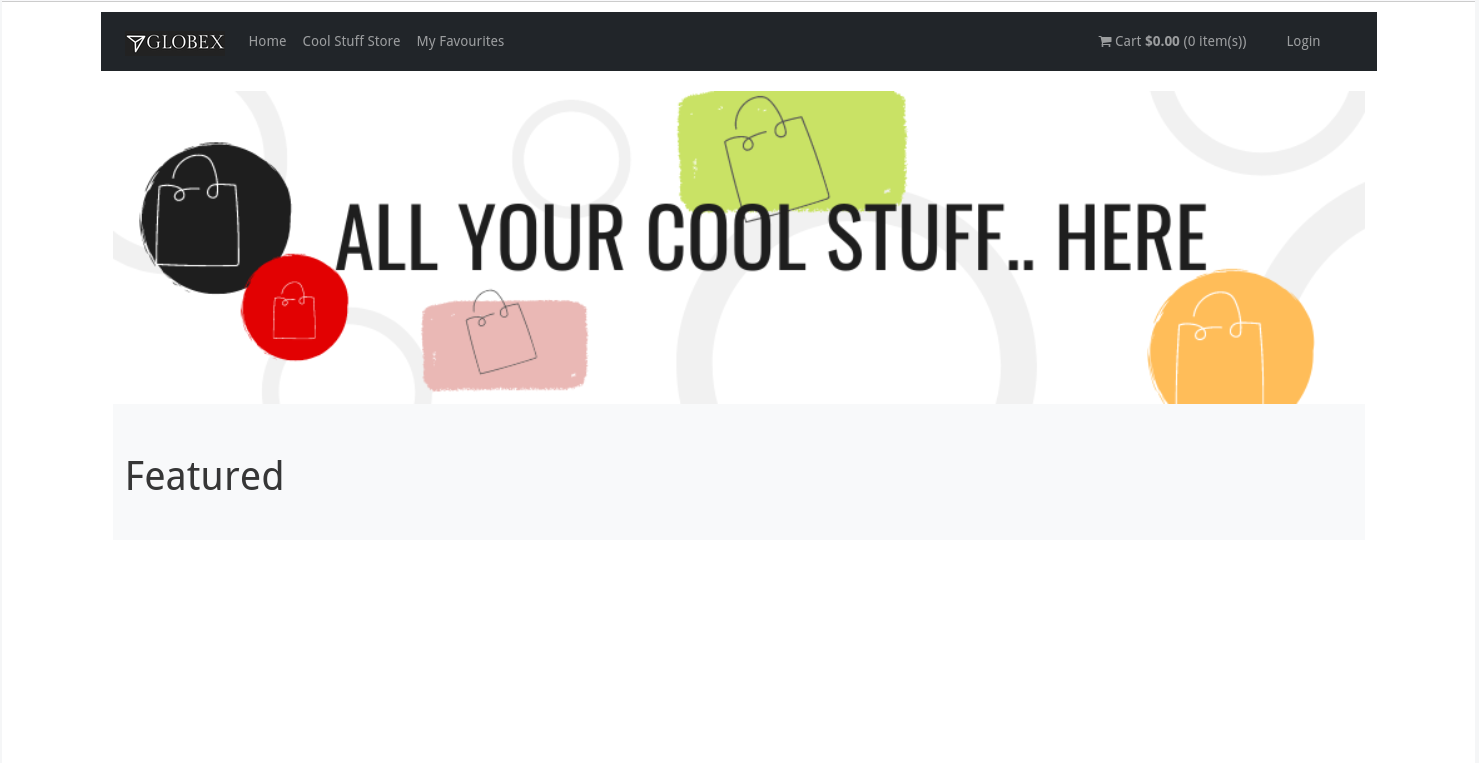
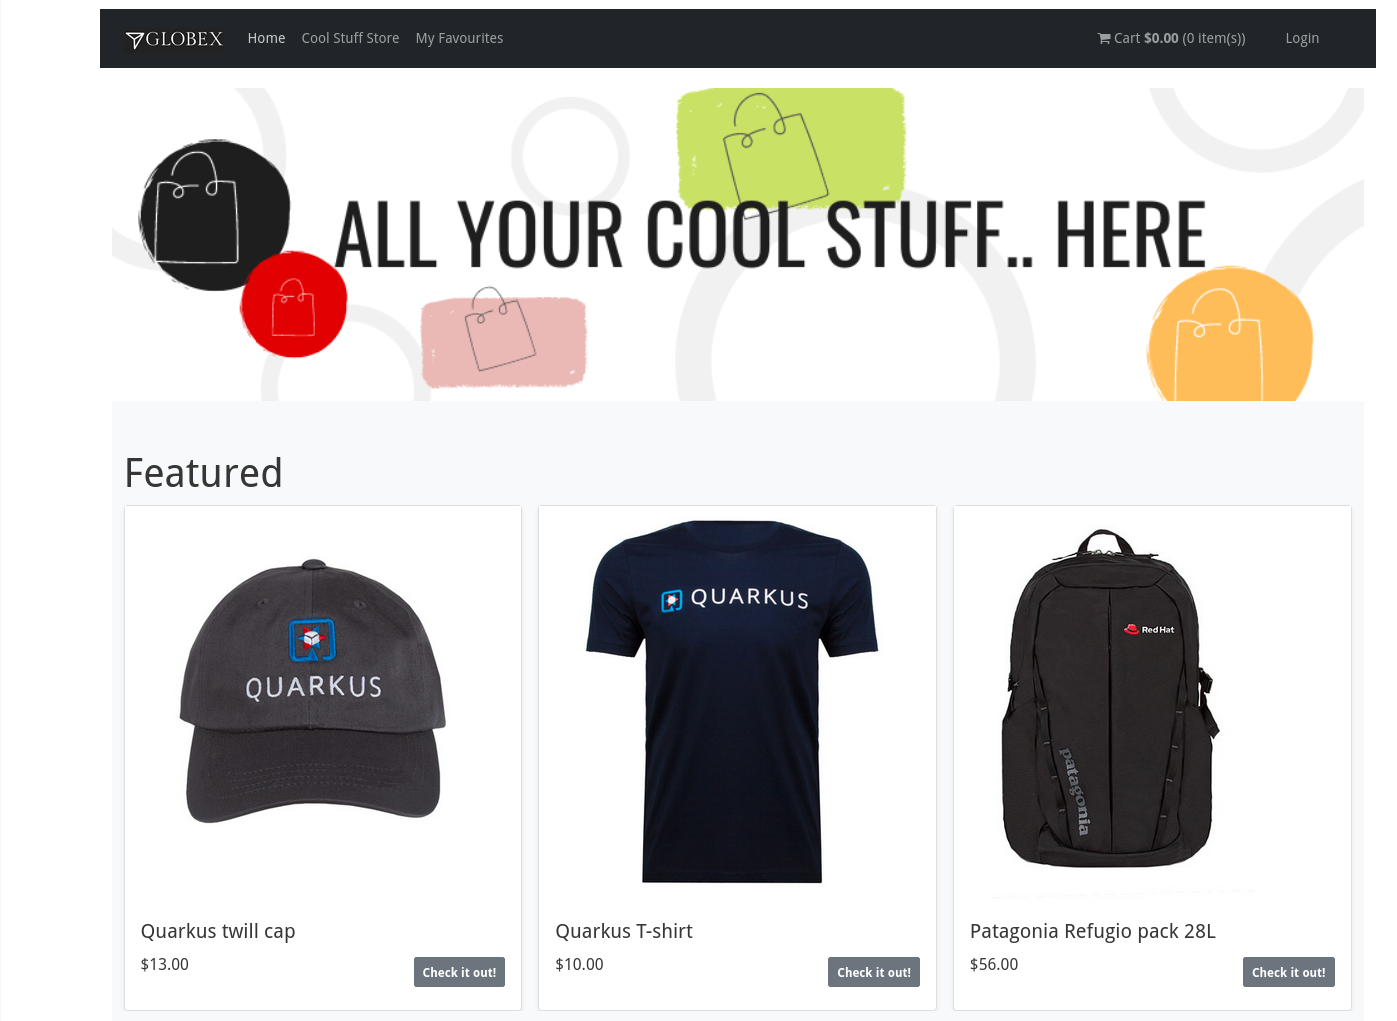
This opens a new browser tab pointing to the home page of the Globex Web application. Alternatively, open a new browser tab and navigate to {globex_web_url}[{globex_web_url}, window="_globex"].
Generate user like activity to view top liked products
-
The featured product list of the Globex web application home page is empty. This is expected as no user activity events have been generated yet.
-
On the Globex web site, click on the Cool Stuff Store link on the top menu. From here you can browse through the product catalog, open product detail pages and add items to the shopping cart.
-
To generate user activity events, click on the
 symbol next to a product. You can repeat this for a couple of products.
 -
Every like action generates a user activity event that is captured by the activity tracking service and sent to a Kafka topic.
The Kafka broker is installed in the globex-mw-{user_name} namespace. In the same namespace, streams for Apache Kafka console, a web UI for viewing Kafka topics and browsing consumer groups, is also installed. -
Click to navigate to streams for Apache Kafka console. This redirects you to the streams for Apache Kafka console login page. For the purpose of this workshop, choose Click to login anonymously to access the console

-
You will be presented with the Home page of the console. You can see that a Kafka cluster has already been setup for you.
You can view details about the Kafka cluster including the number of brokers, the topics and also cluster metrics.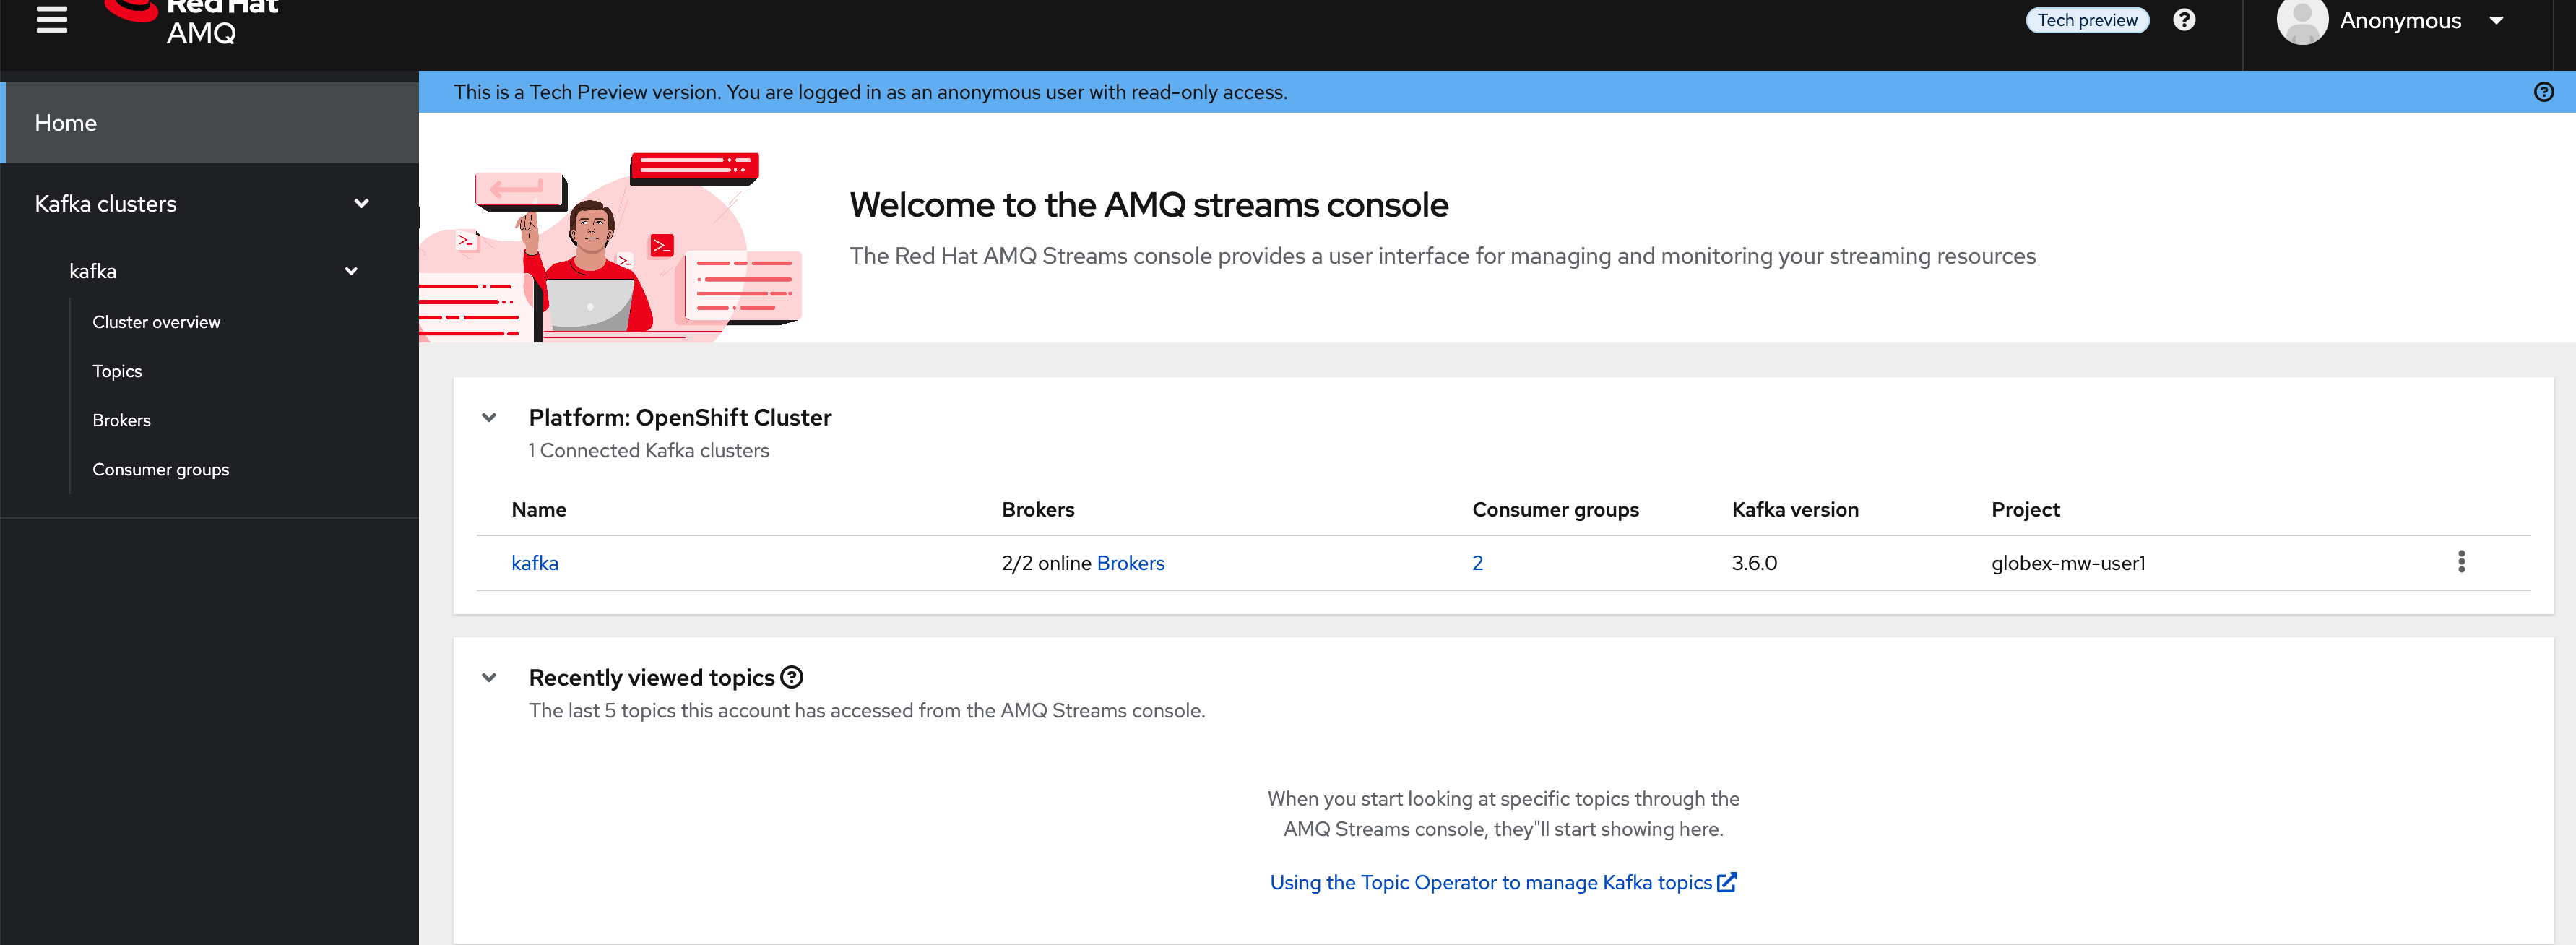
-
Choose the Topics menu on the left-hand side to see the list of topics.
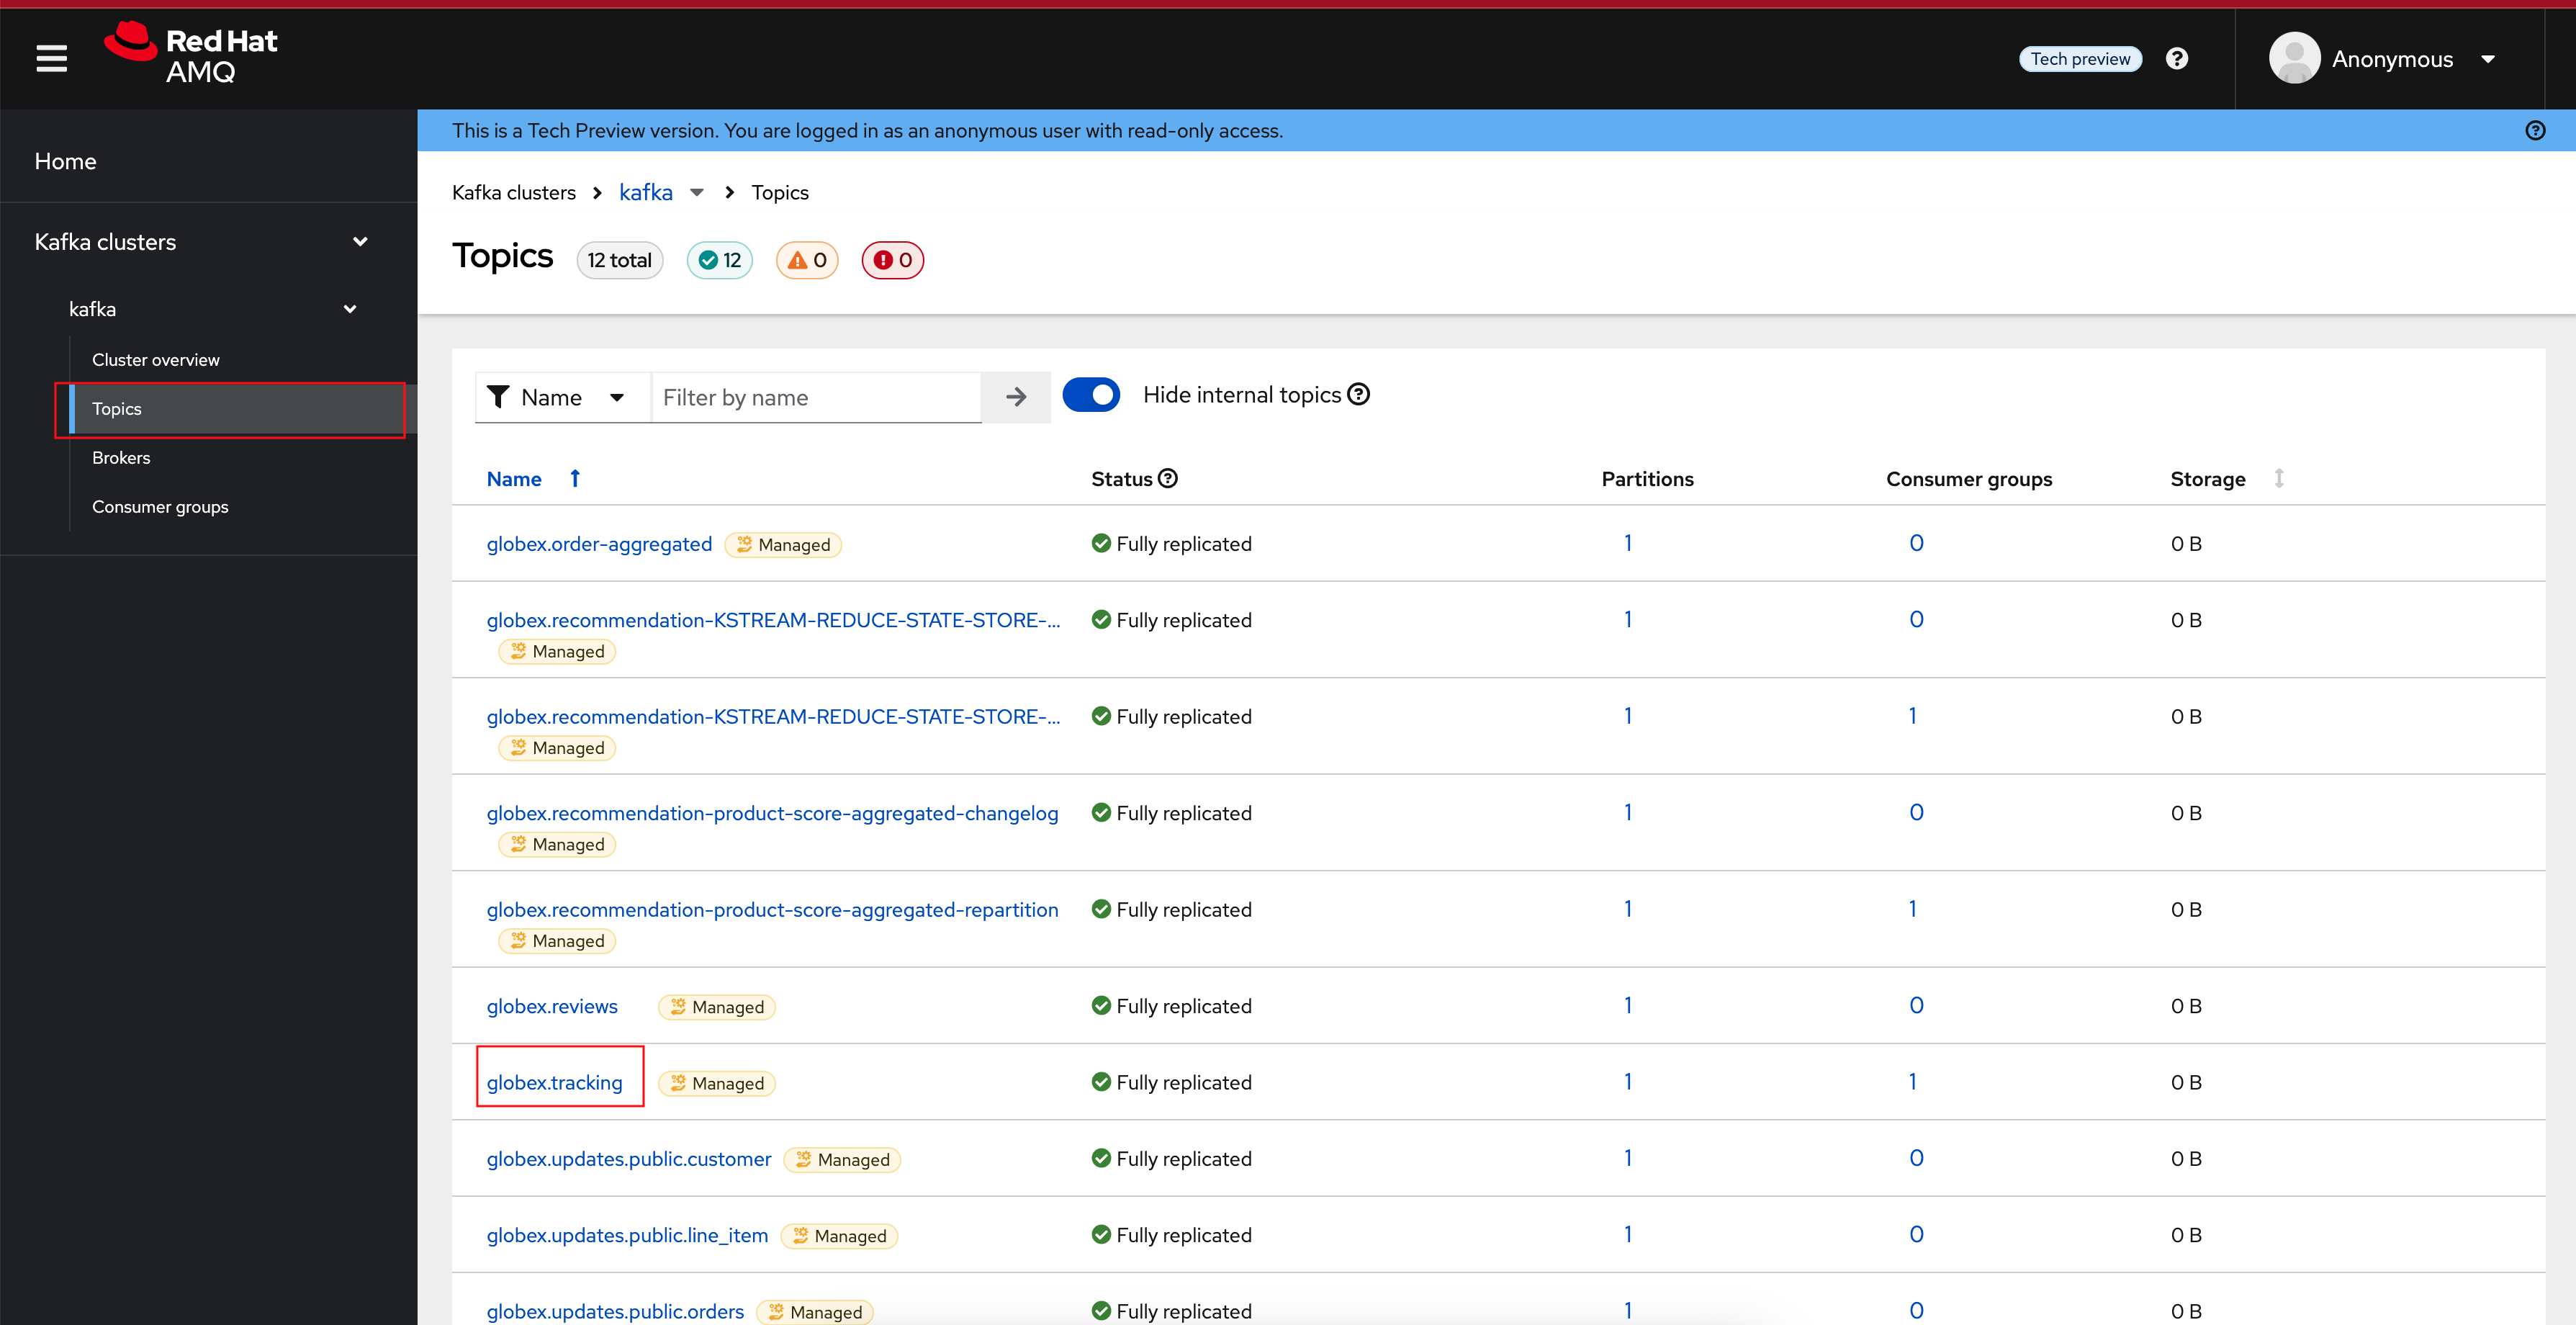
-
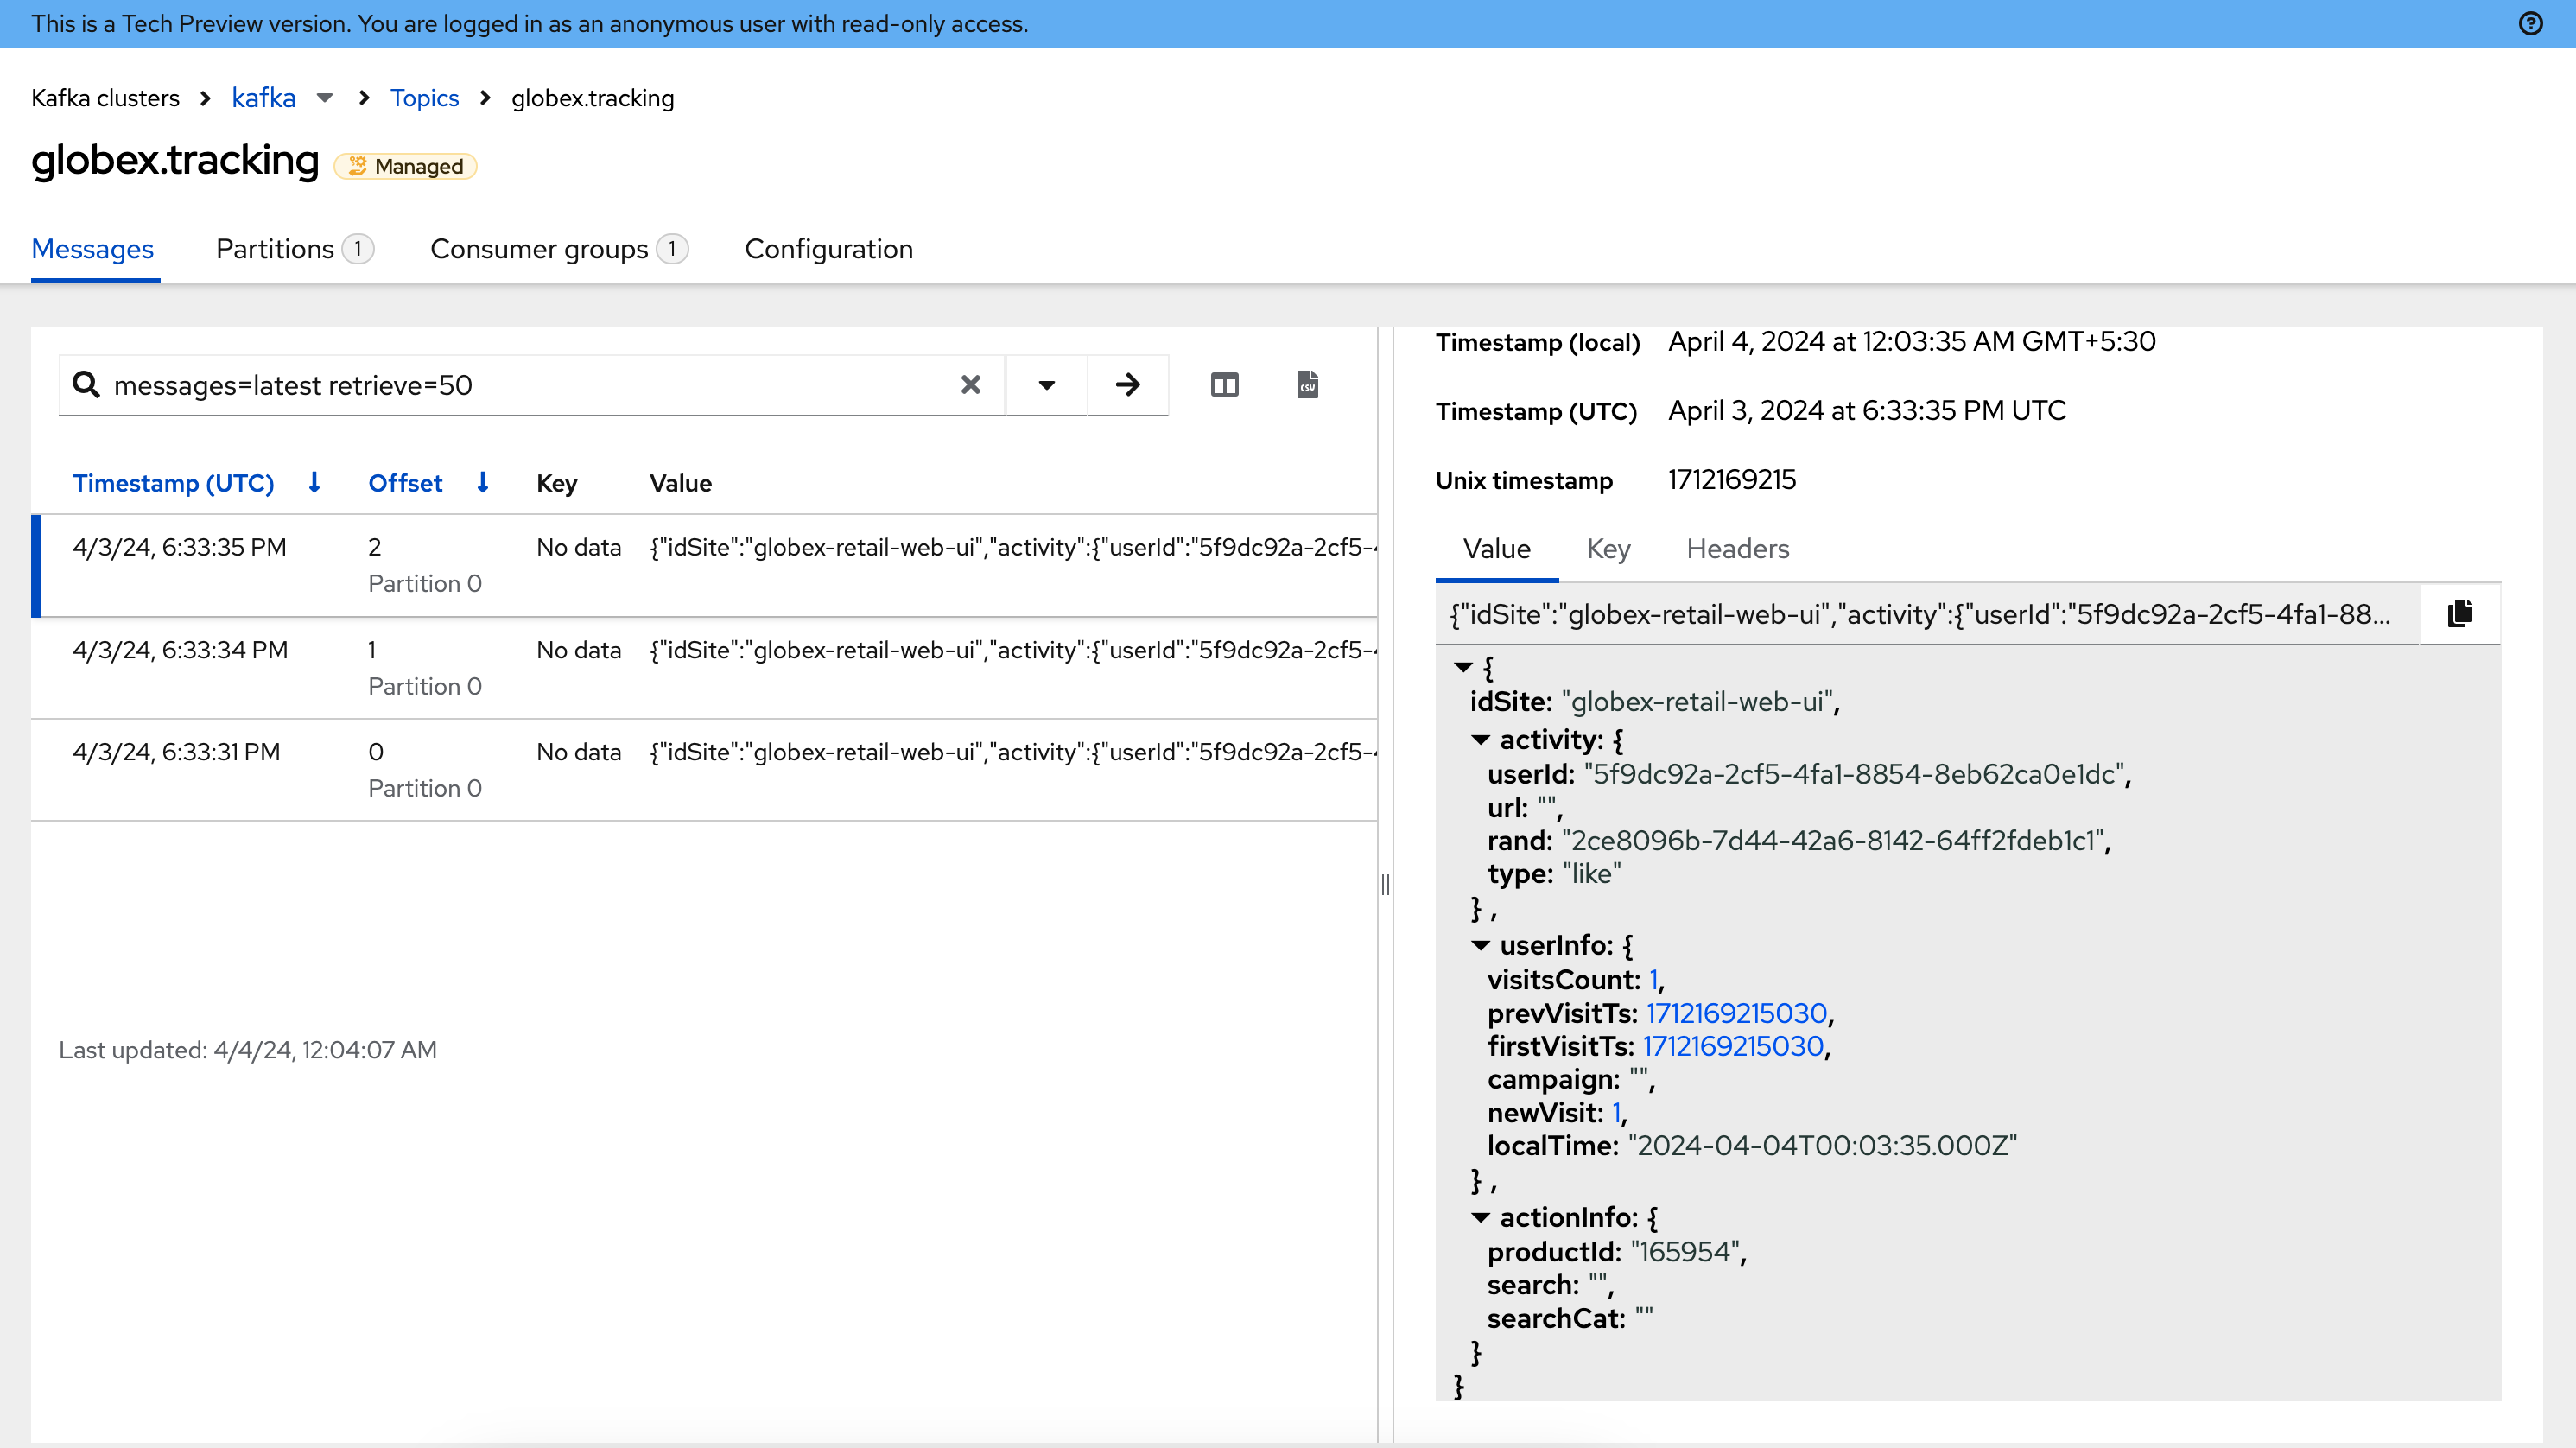
One of those topics is called globex.tracking, which is the topic that contains the user activity events. Click on the topic name to see the details of the topic. If you liked some products on the web site, the topic should contain some messages.
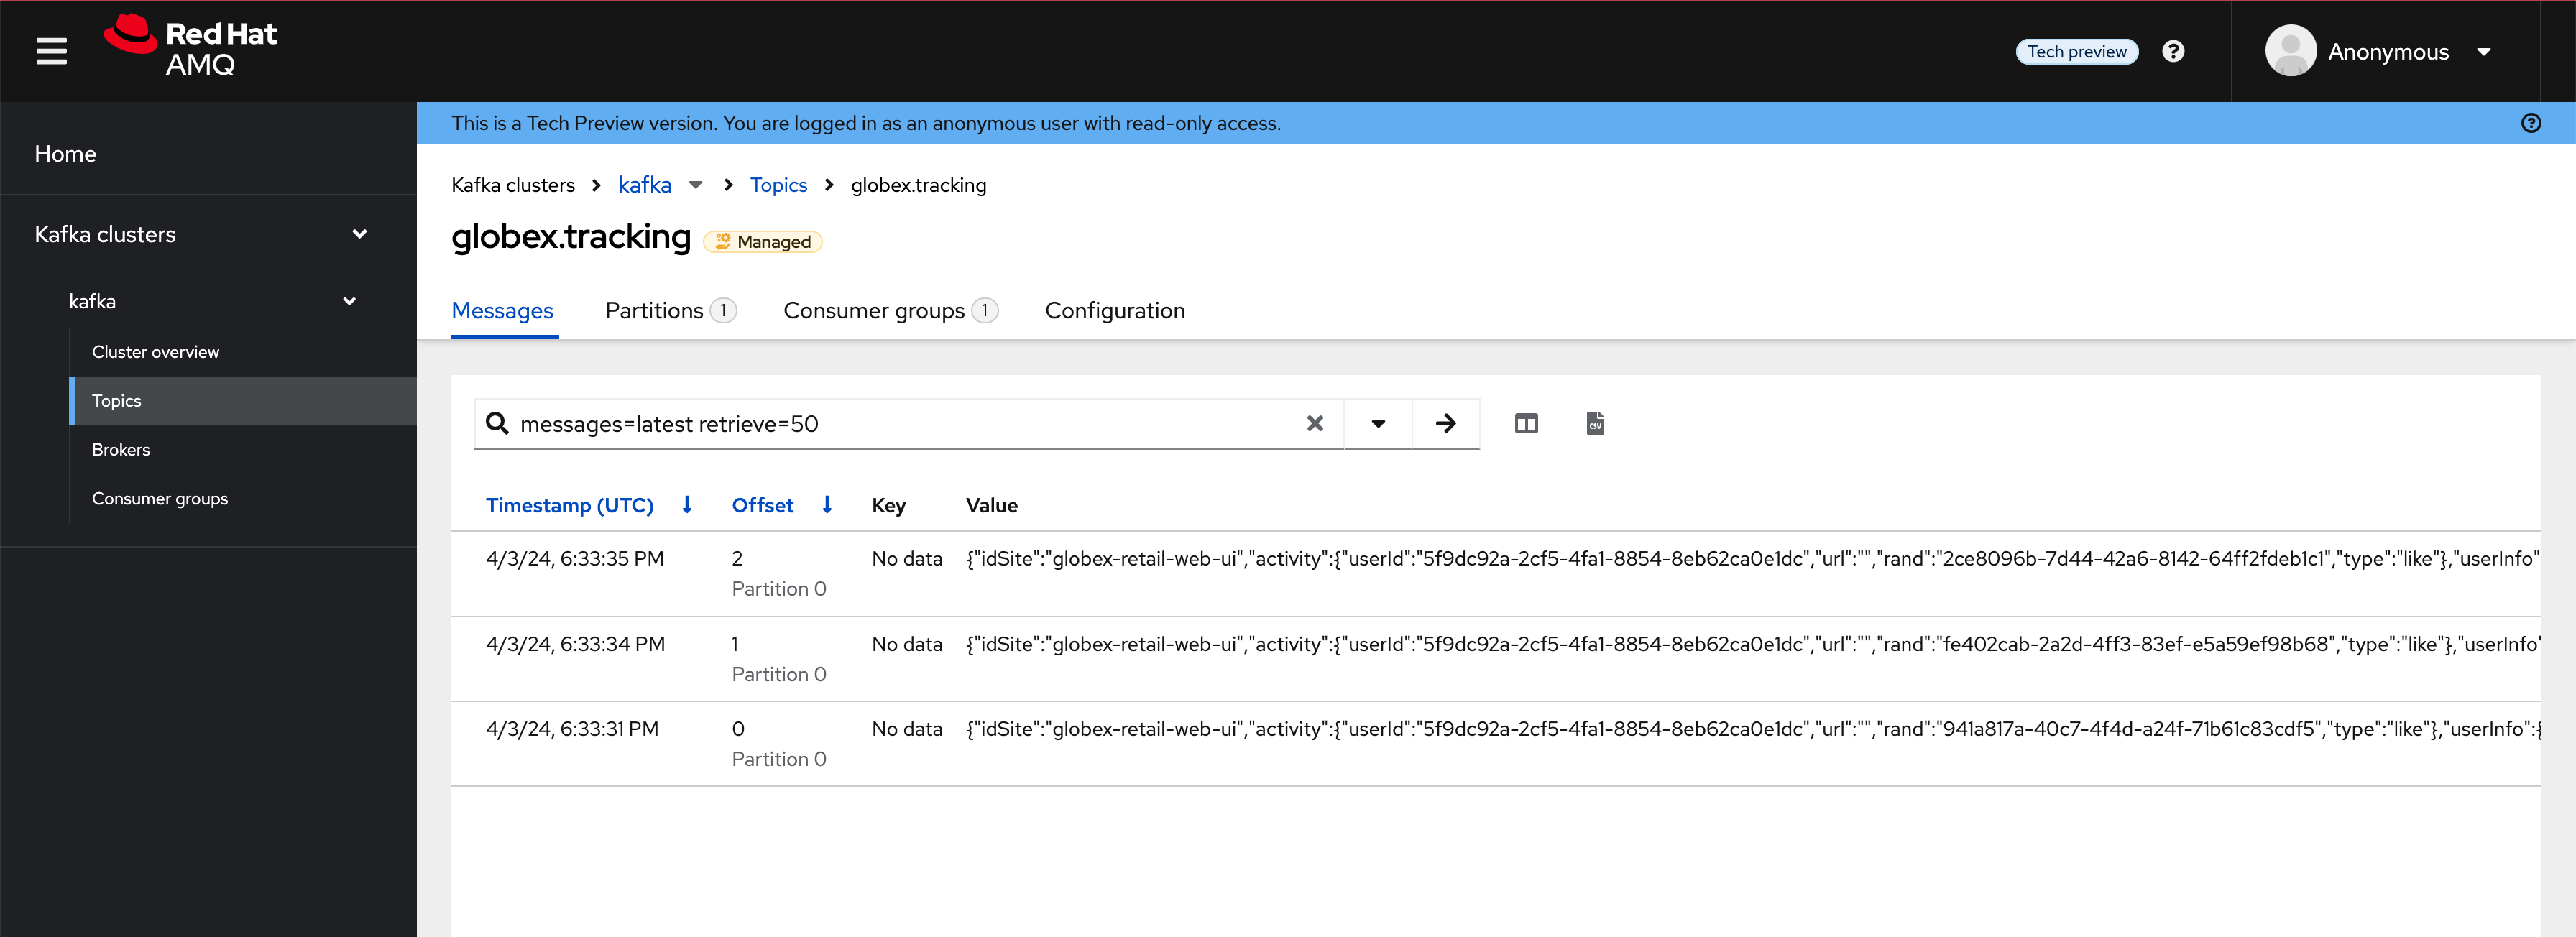
-
Click on any of the messages listed to see its contents. In this case, the body of each message consists of a JSON structure of a user activity event from the Globex web application.
-
If you go back to the list of topics in the streams for Apache Kafka console (click Topics on left-hand side) , you will notice a number of topics starting with globex.recommendation. Those are the topics created by the recommendation engine application, which calculates a list of the most popular products based on the user activity stream.
The globex.recommendation-product-score-aggregated-changelog topic contains messages containing the list of most popular products, where the latest message has the current list.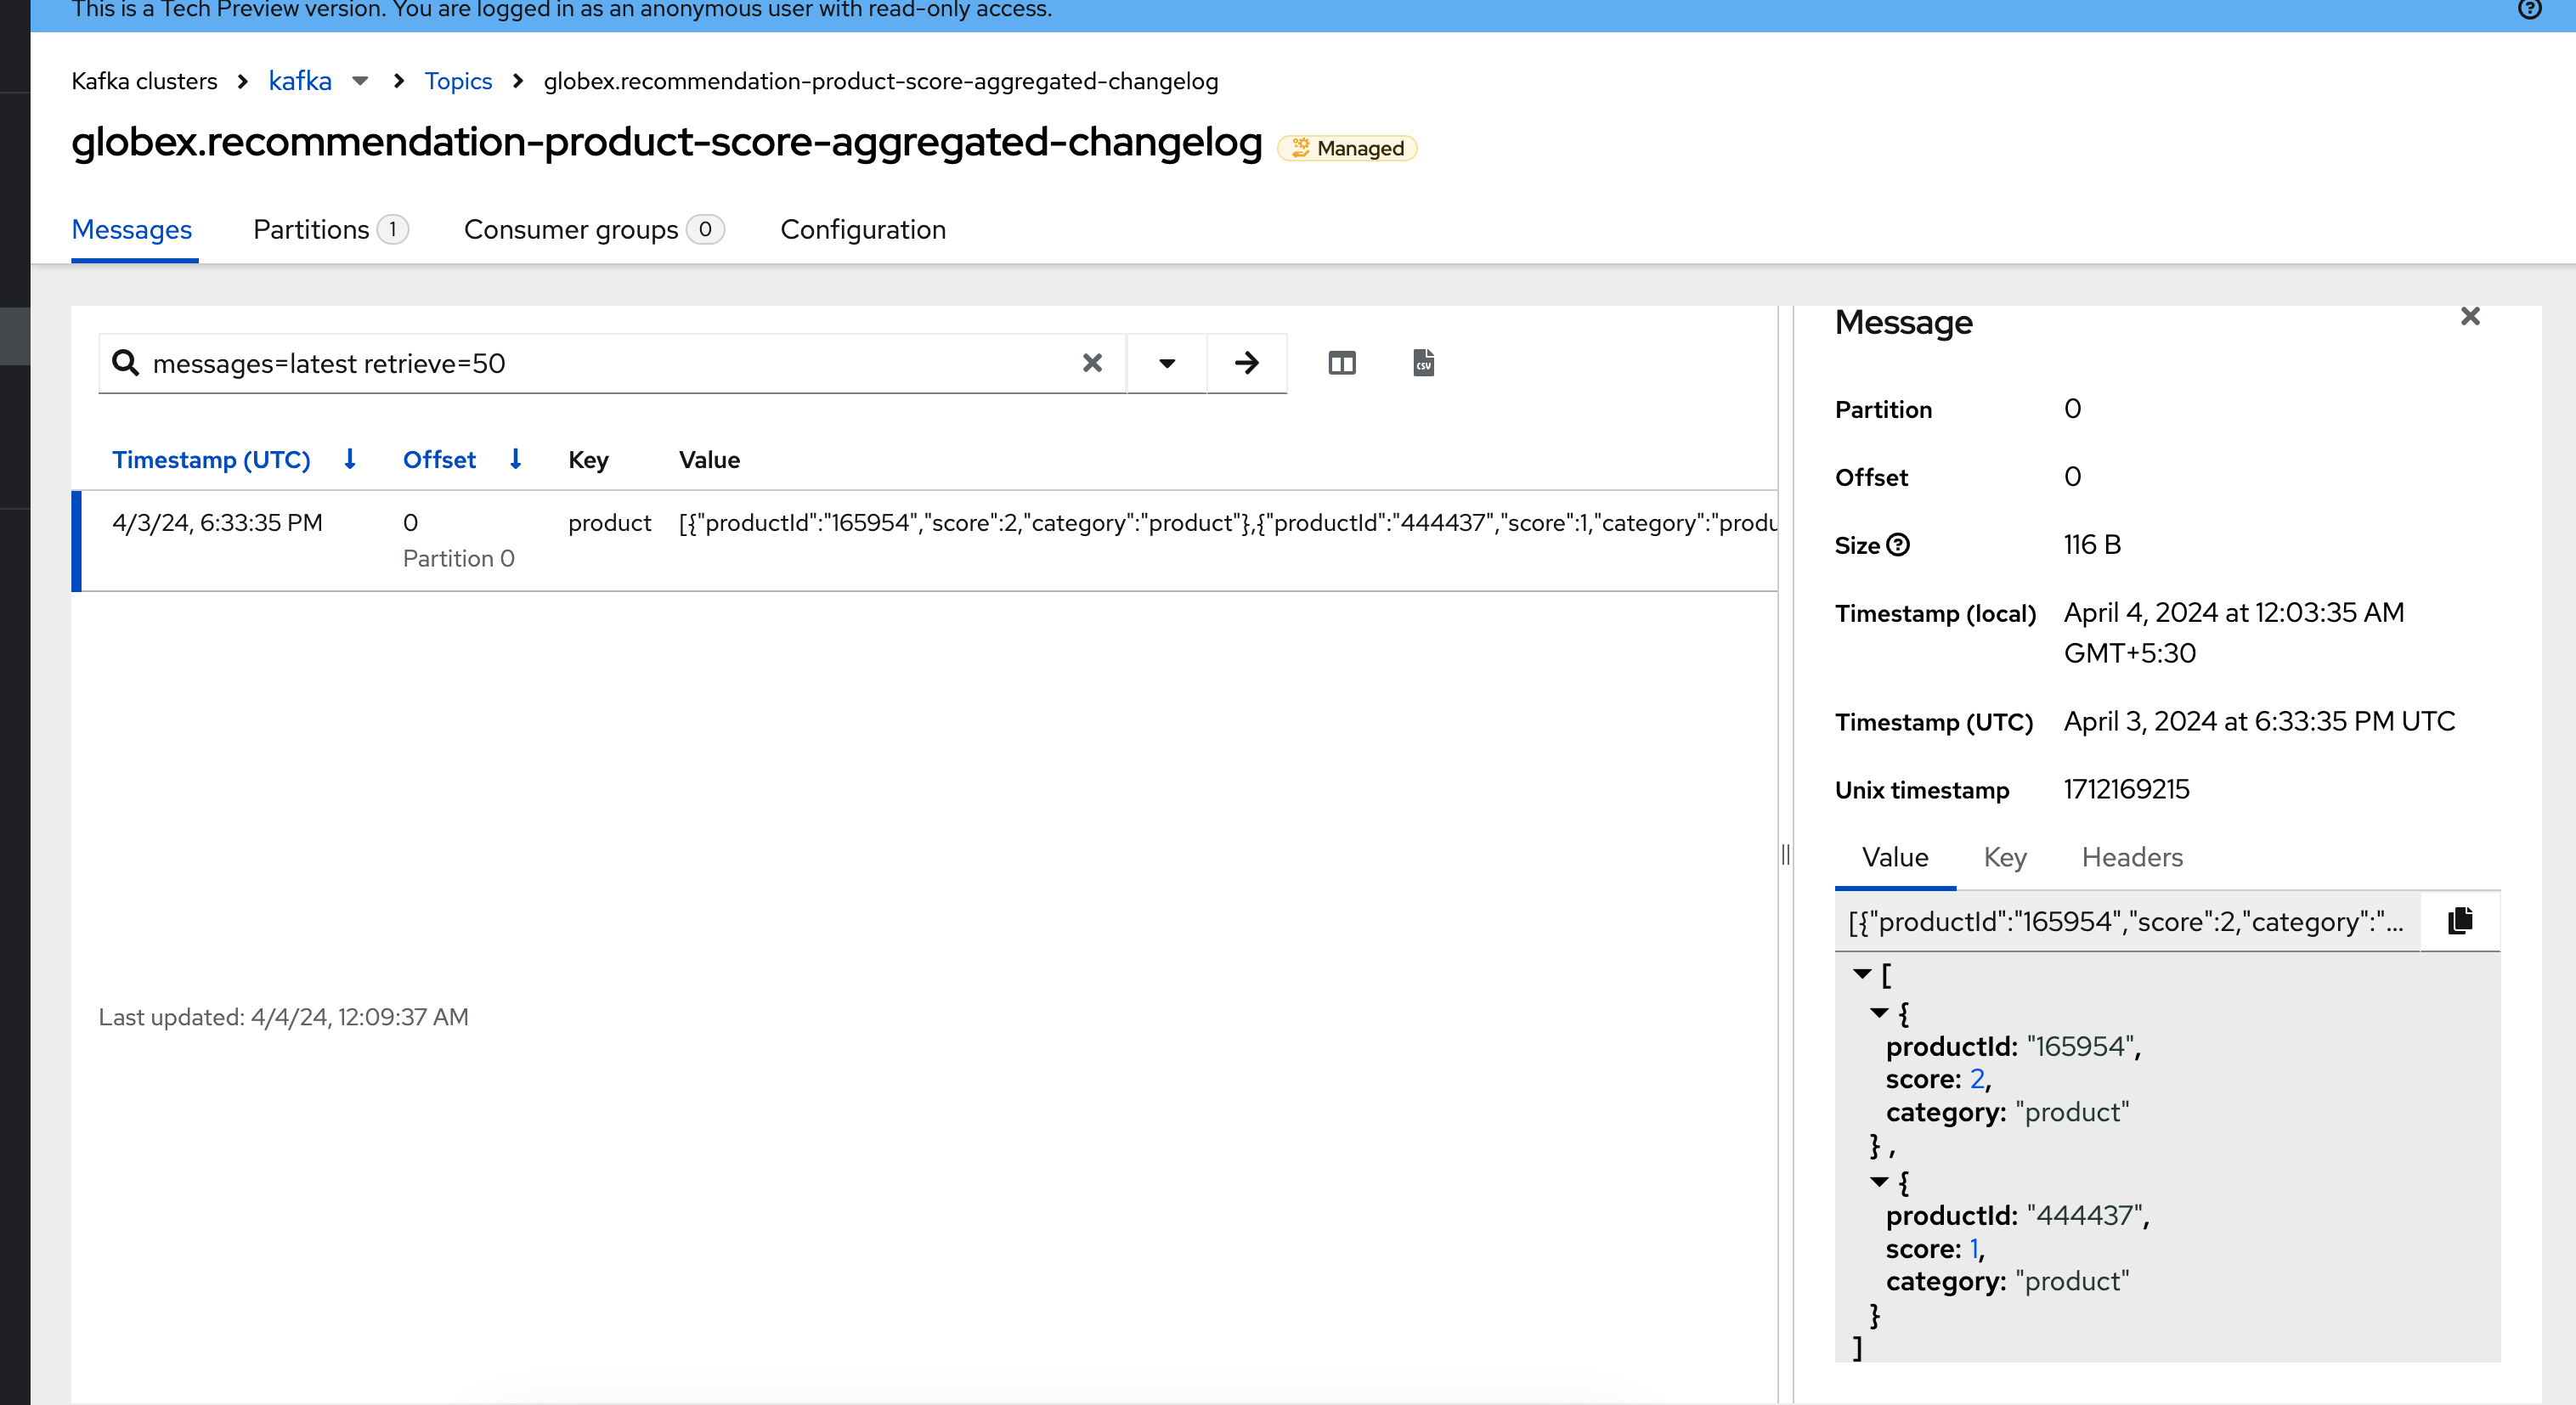
-
In your browser window, go to the tab pointing to the Globex web application. Navigate to the home page. You should see some items in the list of featured products, corresponding to the list of products you liked.
Simulate more user activity
-
To demonstrate that the list of featured products is calculated in real-time, you can simulate a number of user activities using a simulator deployed next to the Globex web application.
To use the simulator, go the the browser tab pointing to the web console of the OpenShift cluster, navigate to the Topology view of the globex-{user_name} namespace, and click the symbol next to the activity-tracking-simulator deployment (it will most likely be abbreviated as shown in the screenshot, hovering over the name will expand it).
Alternative click to open the simulator in a new browser tab - Activity Tracking Simulator.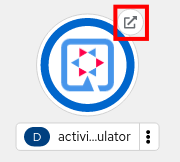
-
This opens a Swagger UI page showing the REST API of the simulator.
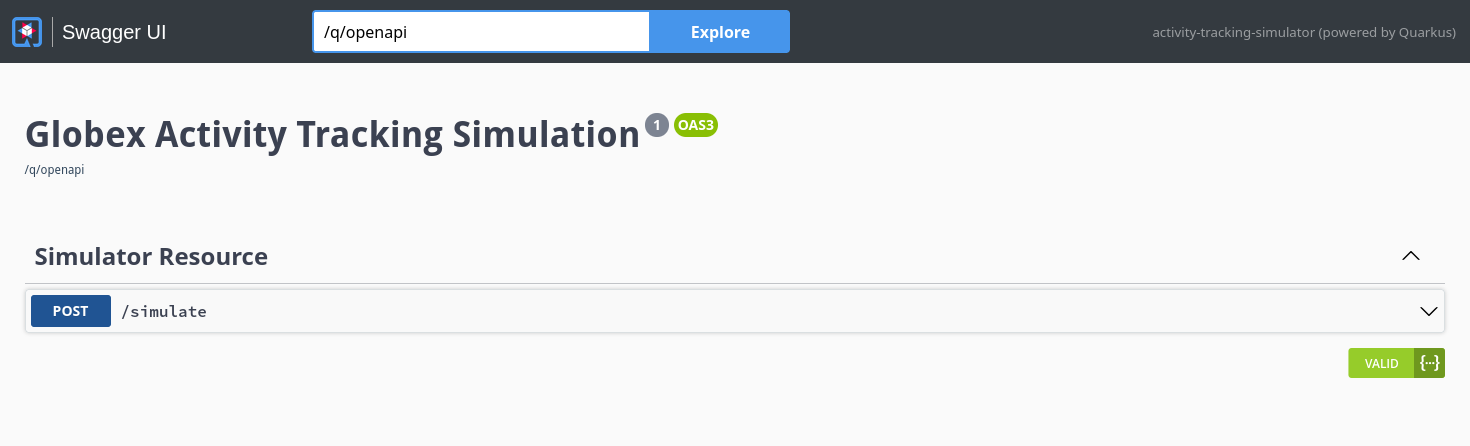
-
Click on the POST link, and then on the Try it out link on the right.
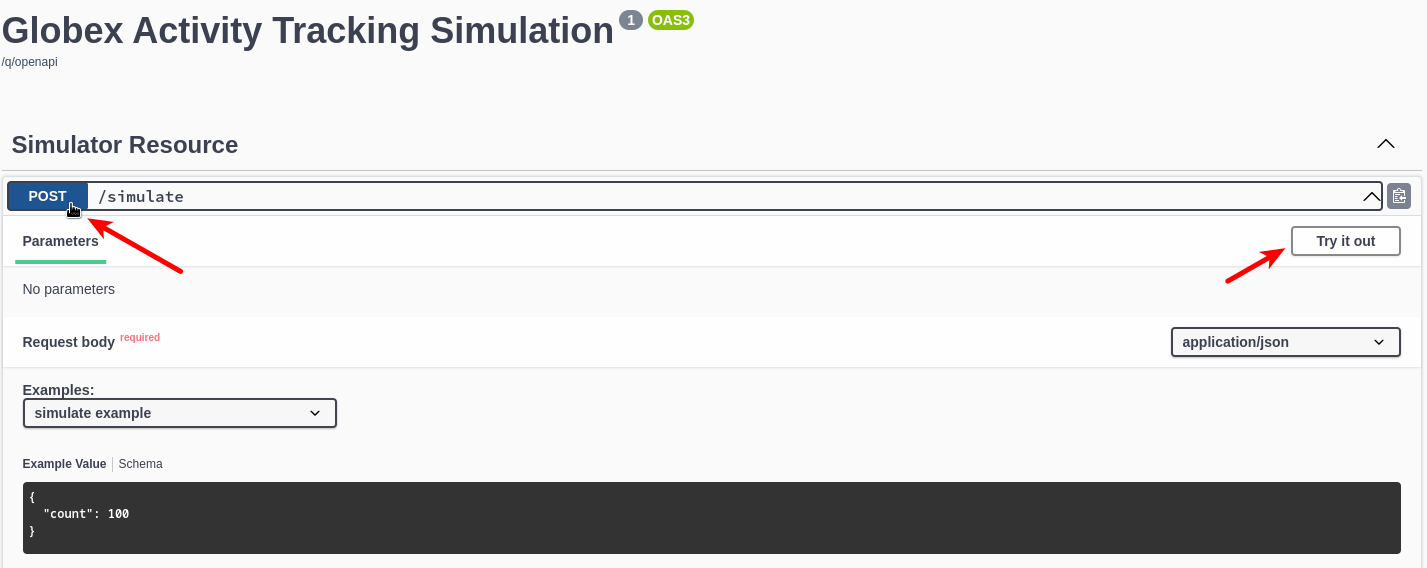
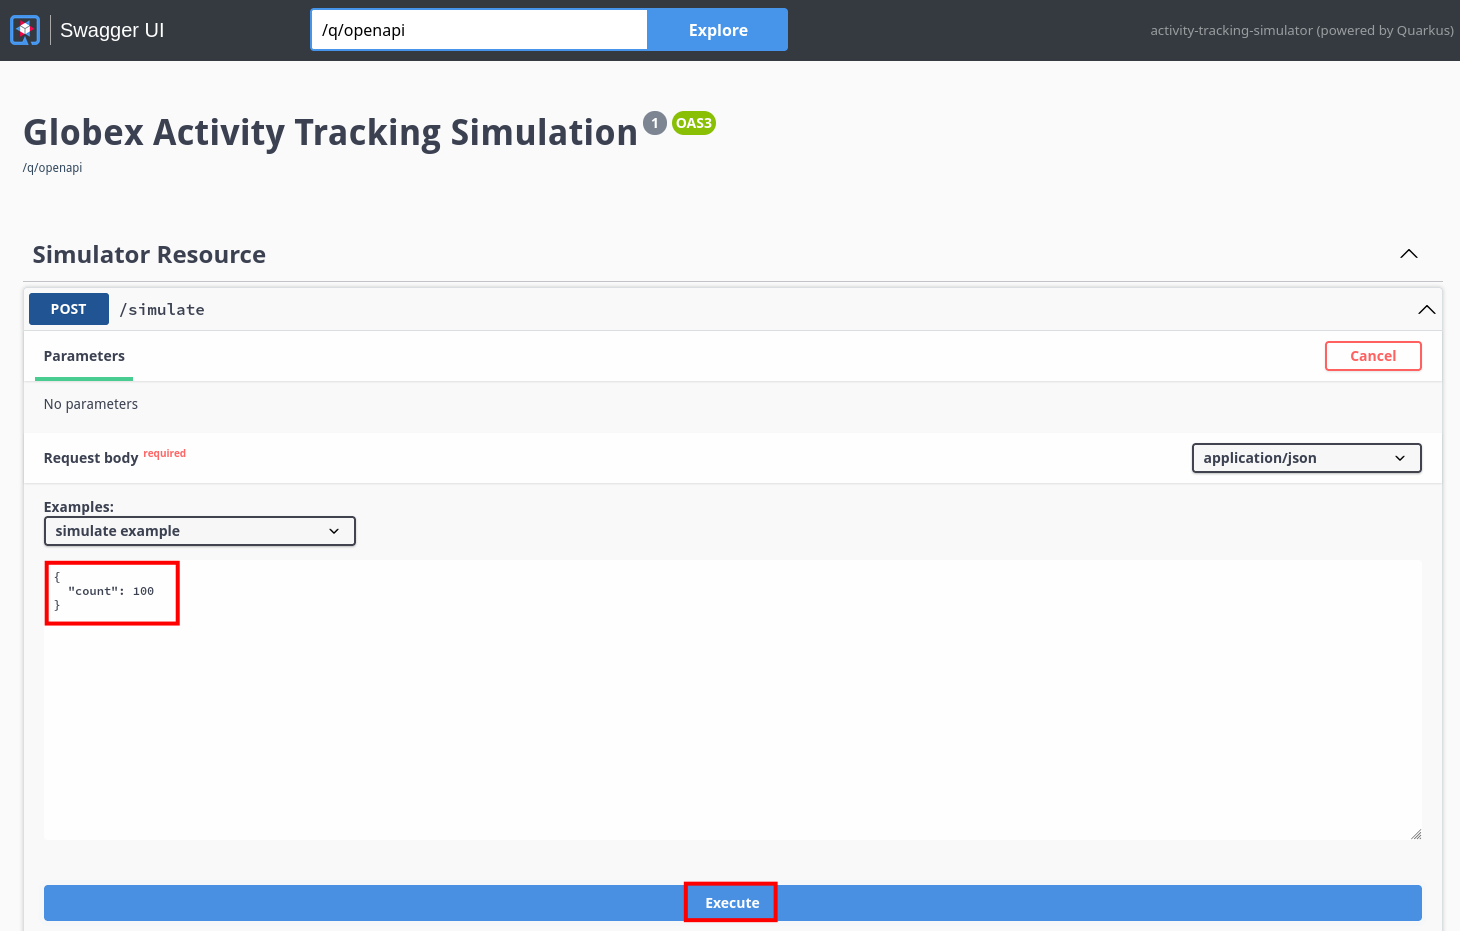
If you want, you change the number of user activities that will be generated (the default is 100). Click Execute to execute the REST call to the simulator.
-
In your browser window, navigate to the tab with the streams for Apache Kafka console, and notice how messages are produced in the globex.tracking topic. After a couple of seconds you should also see new messages in the globex.recommendation-product-score-aggregated-changelog topic, reflecting the newly calculated list of featured products.
Go the browser tab with the Globex we UI, refresh the home page, and notice how the list of featured products has changed, as it is being continuously recalculated.
Wrap up
This concludes the walkthrough of the Globex web application for now. The application provides more features, which you will discover while going through some of the modules of this workshop.
|
Please close all but the Workshop Deployer tab to avoid proliferation of tabs which can make working on other modules difficult. |
Proceed to the Workshop Deployer to choose your next module.